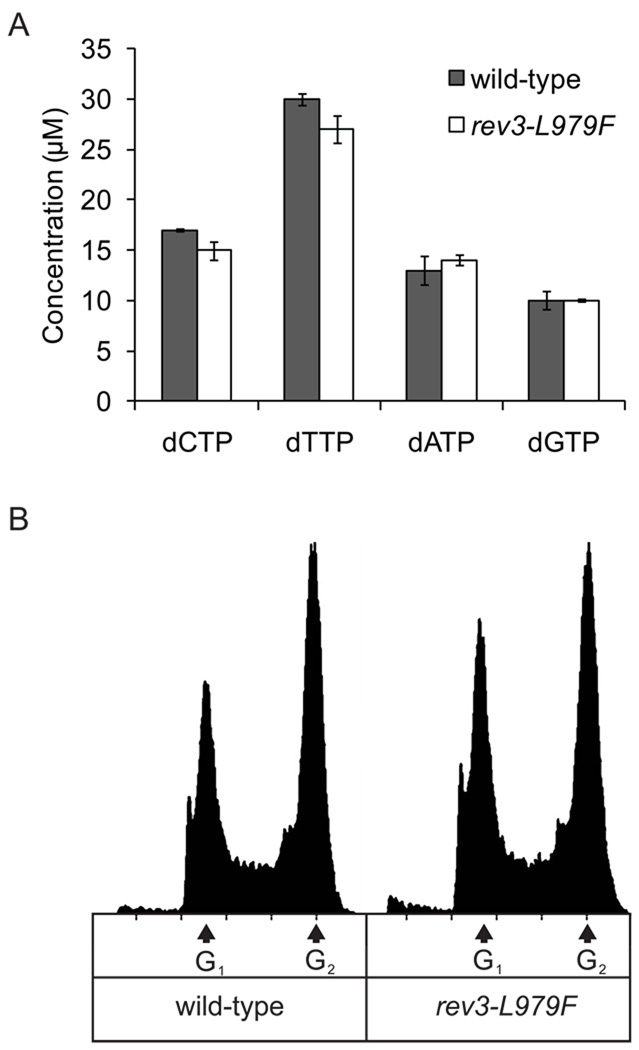
Figure 1. Characteristics of wild-type and rev3-L979F strains of S. cerevisiae.
(A) dNTP concentrations in yeast strains, determined as described [51]. Values are the average of two experiments and error bars represent the standard deviation. (B) Flow cytometry histograms for wild-type and rev3-L979F strains, obtained as described [47]. Arrows indicate the DNA content of cells in the G1 and G2 phases of the cell cycle.

