Figure 1.
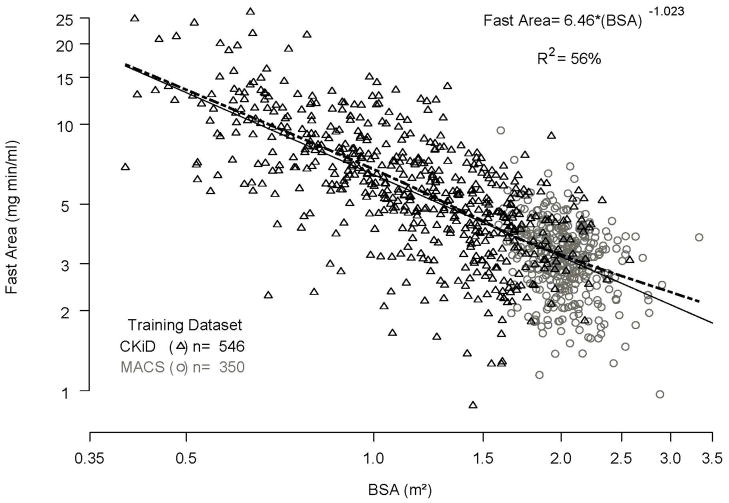
Figure 1a. Relationships between fast area, BSA, and slow area. Regression of fast area (y axis) on body surface area (x axis) in the log scale for the combined MACS and CKiD training dataset. The dashed line represents the nonparametric spline.
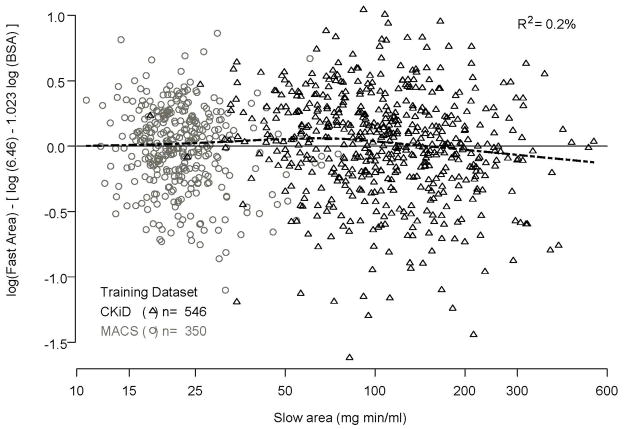
Figure 1b. Non-relationship of residuals from the regression of fast area on body surface area presented in Figure 1A (y axis) and slow area (x axis) from the training dataset.


