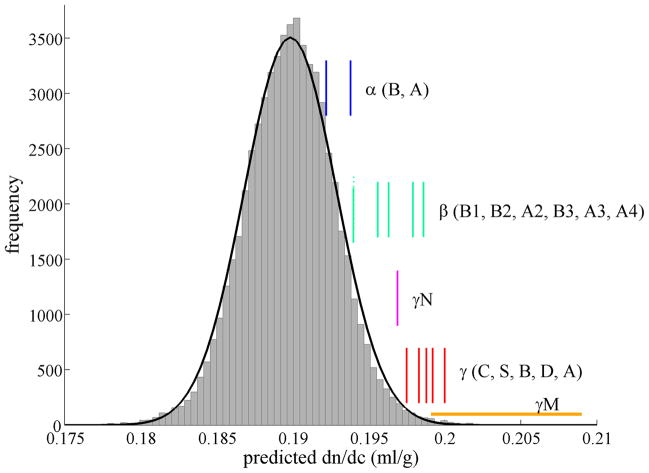
Figure 1.
Refractive index increment of human crystallin genes (vertical bars): human α-crystallin (blue), β-crystallin (green), γN-crystallin (magenta), and γ-crystallin (red). They are drawn superimposed to the dn/dc distribution of all human proteins (histogram for the predicted proteins from the UCSC human genome browser for the human Feb. 2009 (GRCh37/hg19) assembly) 43. The best-fit Gaussian to the distribution of all proteins is indicated as black solid line, with mean of 0.1899 ml/g and standard deviation of 0.0031 ml/g. Also shown is the range of values computed for different fish γM-crystallins (orange horizontal bar), as listed in Table 1.

