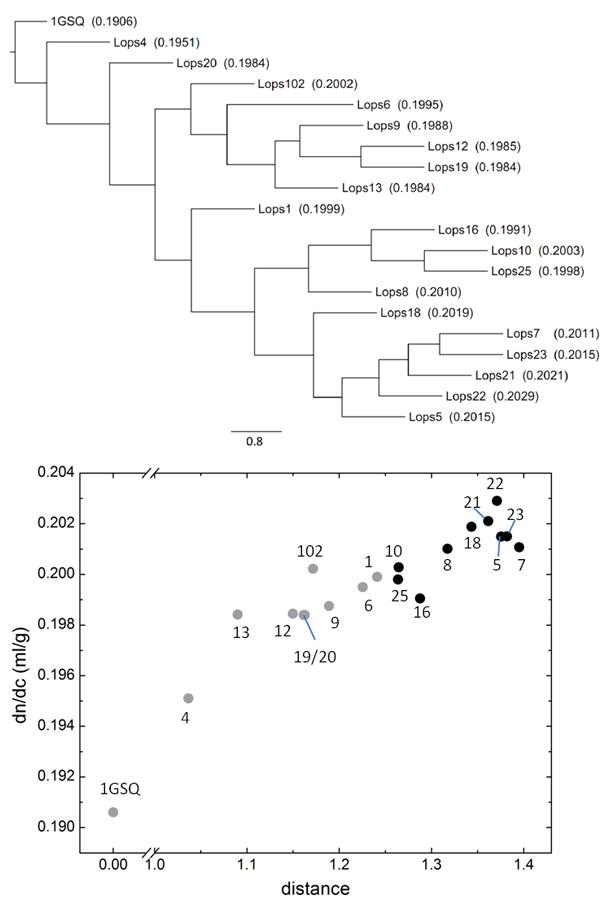
Figure 2.

Relationship between the 24 known S-crystallins from Loligo opalescens and glutathione-S-transferase, in conjunction with their refractive properties. Top: Consensus phylogenetic tree of S-crystallins and squid glutathione-S-transferase, using 1GSQ from Ommastrephes sloani as a reference, from a 500-replicate bootstrap analysis of the neighbor-joining tree. The edge lengths represent the value resolved from bootstrap analysis. The scale bar represents a bootstrap value of 80%. The values in parentheses are the calculated refractive index increment (dn/dc) values. Bottom: Correlation of dn/dc with the distance between each protein to 1GSQ. The distances were calculated by the program protdist in PHYLIP. The identity of the molecules corresponding to each data point is indicated by the associated number. The black circles represent the cluster Lops16 and below in the tree above, all other isoforms are in grey.
