
Figure 3.
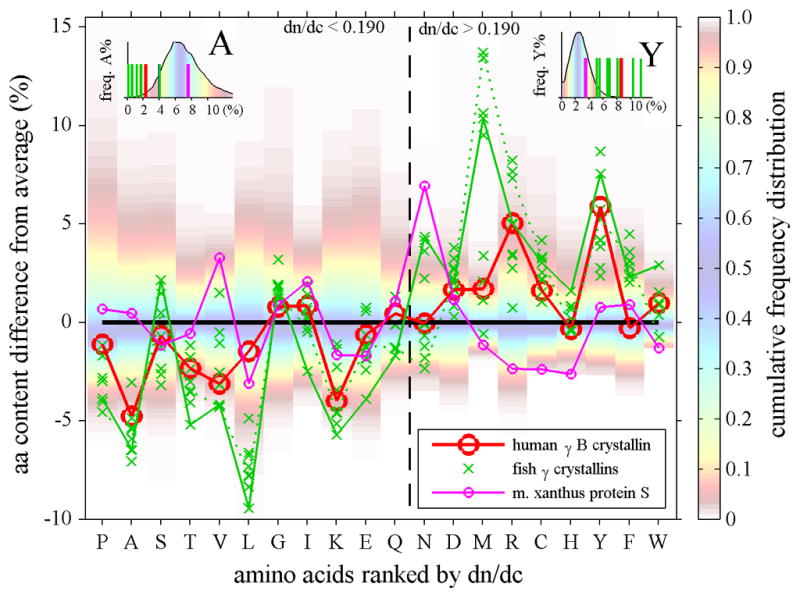
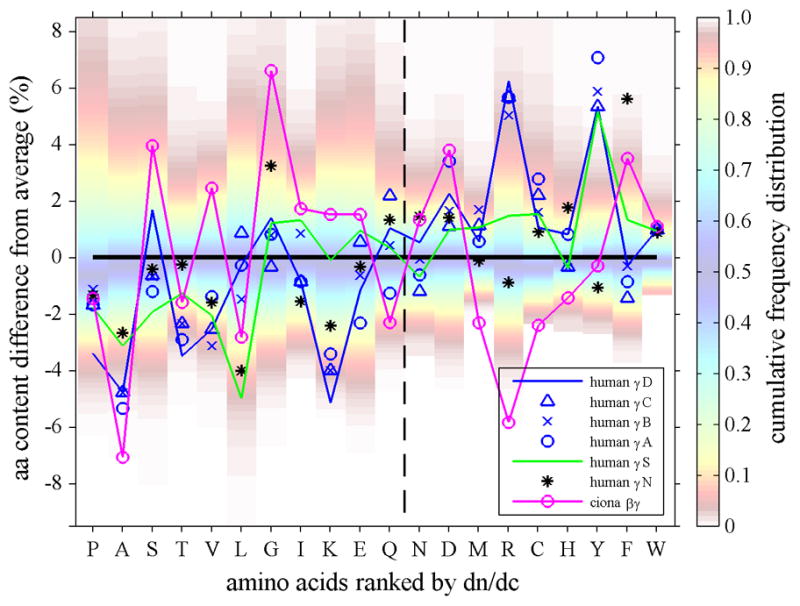
Top Panel: Amino acid composition of γ-crystallins (crosses and triangles) and M. xanthus protein S (magenta line with small circles), plotted as difference of their percent % content from the average content observed in human proteins. Each amino acid is represented in one vertical column. In the background of each column, the color patches indicate the spread of the distribution of fractional amino acid content in all human proteins (Feb. 2009 (GRCh37/hg19) assembly), using the color temperature scale on the right. For example, the range between the red shaded areas (from yellow to blue to yellow) encompasses the content of the amino acid found in approximately the central 80 percent of all proteins, whereas dark red shade fading to white indicates unusually high and low amino acid content among the lowest 5 or highest 95 percentile of all proteins. The insets for A and Y highlight the relationship between the observed amino acid content in crystallins (bars) and the histogram of the frequency distribution of that amino acid content in all proteins (in absolute %). The abscissa shows all amino acids ranked by increasing dn/dc. We can discern that in γ-crystallins the content of low dn/dc residues is mostly lower than average, whereas their content of high dn/dc residues is mostly higher than average. For example, human γB-crystallin (red circles and solid red line) shows values predominantly in the lower left and upper right quadrant. This behavior is particularly evident for A, V, L, T and M, R, Y residues in γ-crystallins of fish (green crosses, showing data from carp, teleostean fish, lip shark, Mexican tetra, and zebra fish), which have contents far outside the normal distribution. Highlighted by the green solid line are the data for (green solid line) and lip shark γ-M2 (green dotted line), which have the highest and second highest values, respectively. In contrast, while Protein S (magenta line and small circles) exhibits unusual content of N and H, it shows values scattered more evenly for both high and low dn/dc residues. Bottom Panel: In the same comparison with the average abundances of the amino acids, shown are the data for different human γ-crystallins (blue symbols, γS is highlighted by a blue line and γD highlighted by a green line) and its closest known ancestor, the urochordate Ci-βγ-crystallin (magenta).