
Figure 7.
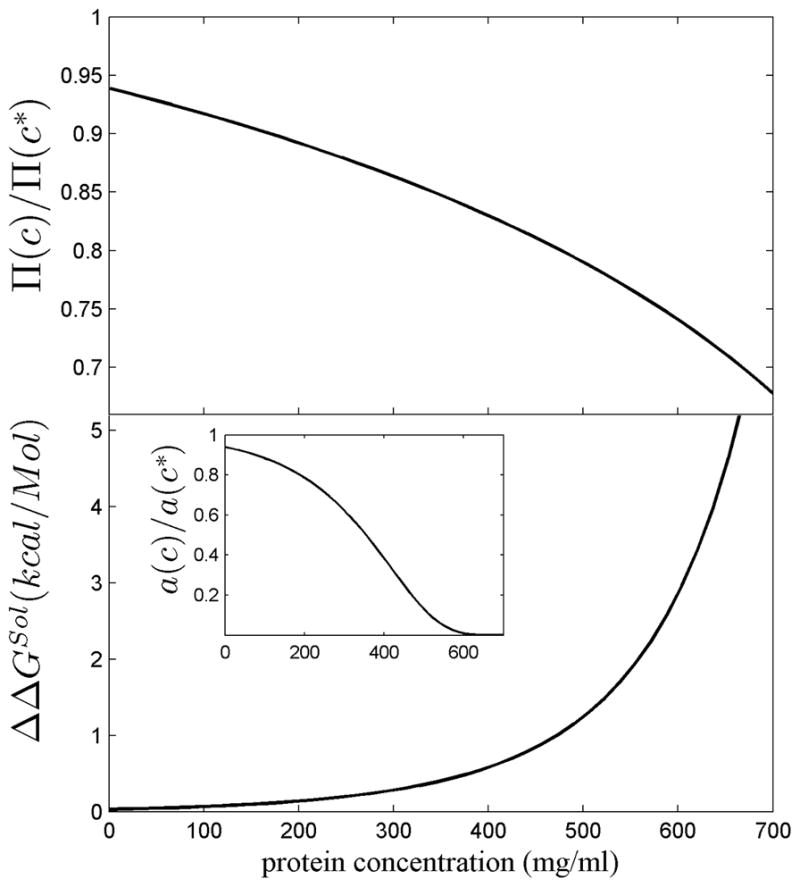
Thermodynamic effect of a crystallin refractive index 6.5% above that of average proteins, corresponding to the value of bovine γ-crystallin. Results are based on a non-interacting hard sphere model of crystallin calculating the excluded volume by scaled particle theory 126, as described in detail in 46, and presented as a function of total protein concentration c. In order to reach the same tissue refractive index as high dn/dc molecules at concentration c, molecules with average dn/dc would have to be present at a higher concentration c*, in the present case c* = 1.065 c. Top Panel: The ratio of the osmotic pressure Π (c)/Π(c*), corresponding to the reduction in osmotic pressure arising from the high dn/dc. Bottom: The difference in the free energy of transfer of a crystallin molecule from the soluble phase into a polymer phase, ΔGSol(c), to the same free energy at a higher crystallin concentration, ΔGSol(c*), with ΔΔGSol(c) = ΔGS(c) - ΔGS(c*). The calculations are based on a ‘crystal approximation’ 87,88. The positive sign of ΔΔGSol means that at the lower concentration afforded by the increase in dn/dc makes the transition into the polymer phase less favorable. The insert shows the ratio of the chemical activity (i.e. ratio of ‘effective’ concentrations) arising from a 6.5% lower actual protein concentration.