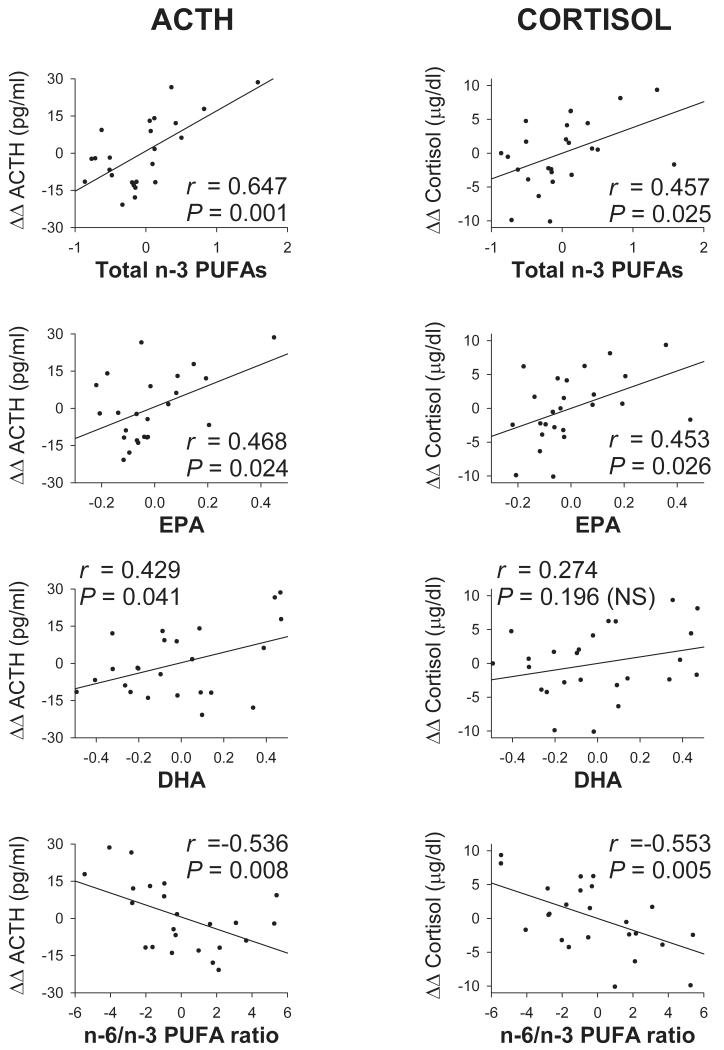
Figure 1.
Patients’ partial regression plots of ACTH and cortisol responses (ΔΔs) to fenfluramine as a function of some PUFA values, using age as a control variable. PUFA values are expressed as % of total FAs. Regression lines, partial correlation coefficients (r) and their levels of significance are shown in each plot. Correlations are positive for total n-3 PUFAs, EPA and DHA. They are negative for the n-6/n-3 PUFA ratio.

