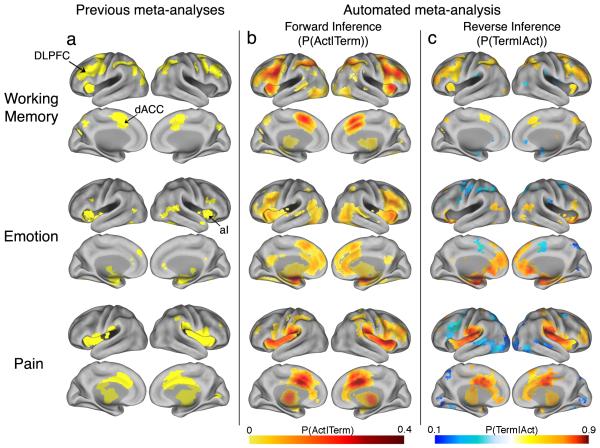
Figure 2.
Comparison of previous meta-analysis results with forward and reverse inference maps produced automatically using the NeuroSynth framework. Meta-analyses were carried out for working memory (top row), emotion (middle row), and physical pain (bottom row), and mapped to the PALS-B12 atlas45. (a) Meta-analytic maps produced manually in previous studies14-16. (b) Automatically generated forward inference maps displaying the probability of observing activation given the presence of the term (i.e., P(Activation|Term)). (c) Automatically generated reverse inference maps display the probability of the term given observed activation (i.e., P(Term|Activation)). Thus, regions in (b) are consistently associated with the term, and regions in (c) are selectively associated with the term. To account for base differences in term frequencies, reverse inference maps assume uniform priors (i.e., equal 50% probabilities of Term and No Term). Activation in orange/red regions implies a high probability that a term is present, and activation in blue regions implies a high probability that a term is not present. Values for all images are displayed only for regions that are significant for a test of association between Term and Activation, with a whole-brain correction for multiple comparisons (FDR = .05). DLPFC = dorsolateral prefrontal cortex; dACC = dorsal anterior cingulate cortex; aI = anterior insula.

