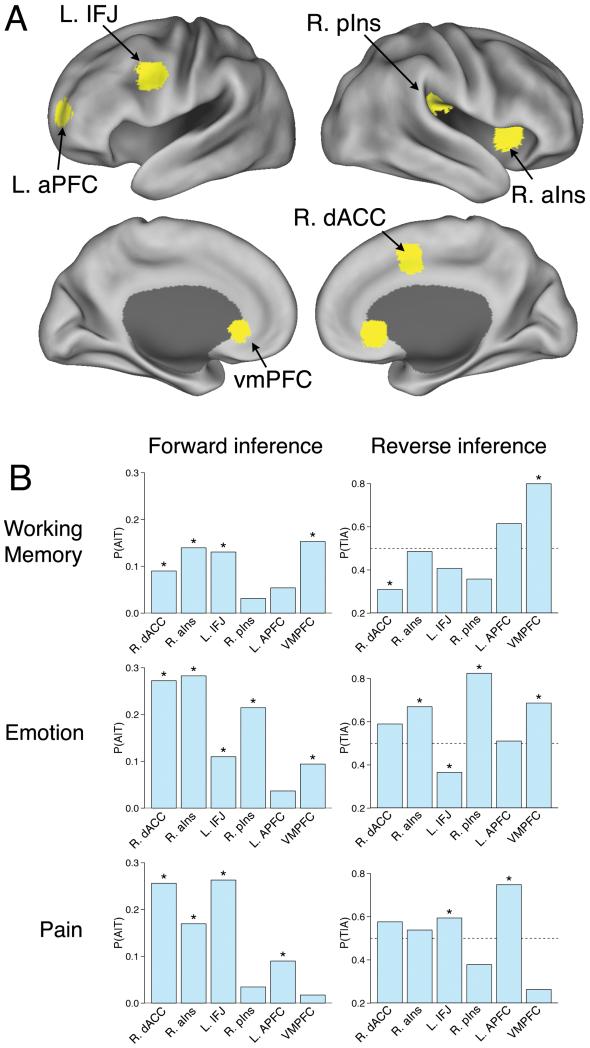
Figure 3.
Comparison of forward and reverse inference in selected regions of interest. (a) Labeled regions of interest displayed on lateral and medial brain surfaces. (b) Comparison of forward inference (i.e., probability of activation given term P(T|A)) and reverse inference (probability of term given activation P(A|T)) for the domains of working memory (top), emotion (middle), and pain (bottom). Bars with asterisks denote statistically significant effects (whole-brain FDR, q = .05). dACC = dorsal anterior cingulate cortex (coordinates: +2, +8, +50); aIns = anterior insula (+36, +16, +2); IFJ = inferior frontal junction (−50, +8, +36); pIns = posterior insula (+42, −24, +24); aPFC = anterior prefrontal cortex (−28, +56, +8); vmPFC = ventromedial prefrontal cortex (0, +32, −4). L and R refer to the left and right hemispheres, respectively.

