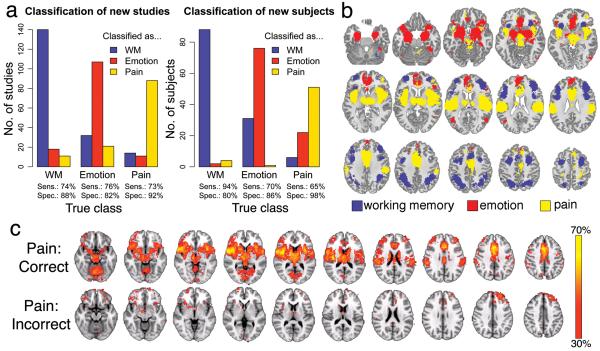
Figure 4.
Three-way classification of working memory (WM), emotion, and pain. (a) Naive Bayes classifier performance when cross-validated on studies in the database (left) or applied to entirely new subjects (right). Sens. = sensitivity; Spec. = specificity. (b) Whole-brain maximum posterior probability map; each voxel is colored by the term with the highest associated probability. (c) Whole-brain maps displaying the proportion of individual subjects in the three pain studies (total n = 79) who showed activation at each voxel (P < .05, uncorrected), averaged separately for subjects who were correctly (n = 51; top row) or incorrectly (n = 28; bottom row) classified. Regions are color-coded according to the proportion of subjects in the sample who showed activation at each voxel.

