
Figure 2.
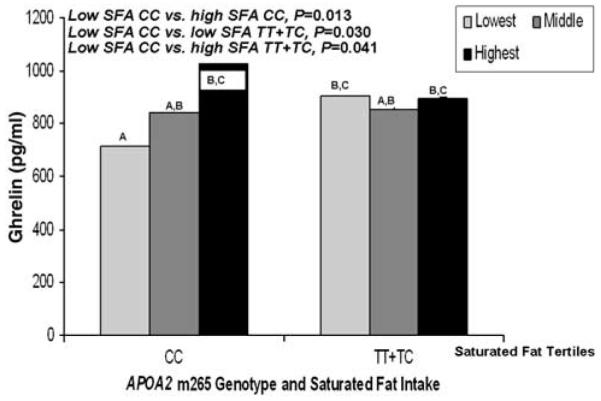
Mean plasma ghrelin (pg ml−1) by APOA2 m265 genotype and tertiles of saturated fat intake (n=425). Lowest saturated fat, <8.1 (percentage of total energy); middle saturated fat, ≥8.1 (percentage of total energy) and <13.1 (percentage of total energy); highest saturated fat, ≥13.1 (percentage of total energy). Means were adjusted for age, gender and centre. P-values were obtained through comparisons of means for genotype according to saturated fat intake. P for interaction was obtained for the interaction between genotype and saturated fat intake. Means marked with different letters differ, P<0.05.