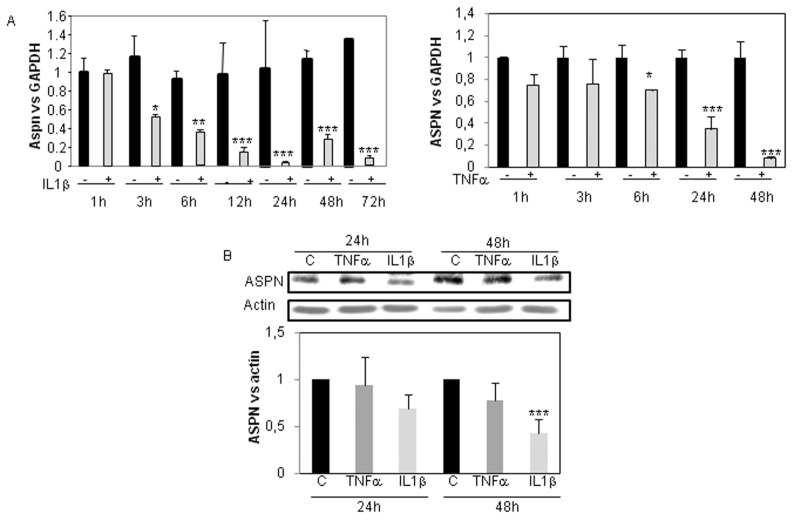
Figure 2.
ASPN inhibition by IL-1β and TNFα (time-response). Primary cultures of HACs (P0 [no passage]) were cultured for 6–7 d in DMEM + 10% FCS and then maintained for 24 h in DMEM + 2% FCS before adding 1 ng/mL IL-1β or TNFα. They were incubated with these cytokines for the indicated times. ASPN mRNA level was defined by RT-PCR. Graphs represent modulation of ASPN mRNA level after normalization to GAPDH signal. Values are the mean and SD of triplicate experiments (A). Similar experiments were performed before protein extraction. Then ASPN protein level was analyzed by Western blot. The amounts of ASPN protein were quantified by densitometry using ImageJ, normalized against β-actin. Histograms represent the mean of values relative to control and SD of three experiments (B). C, control.

