Figure 2.
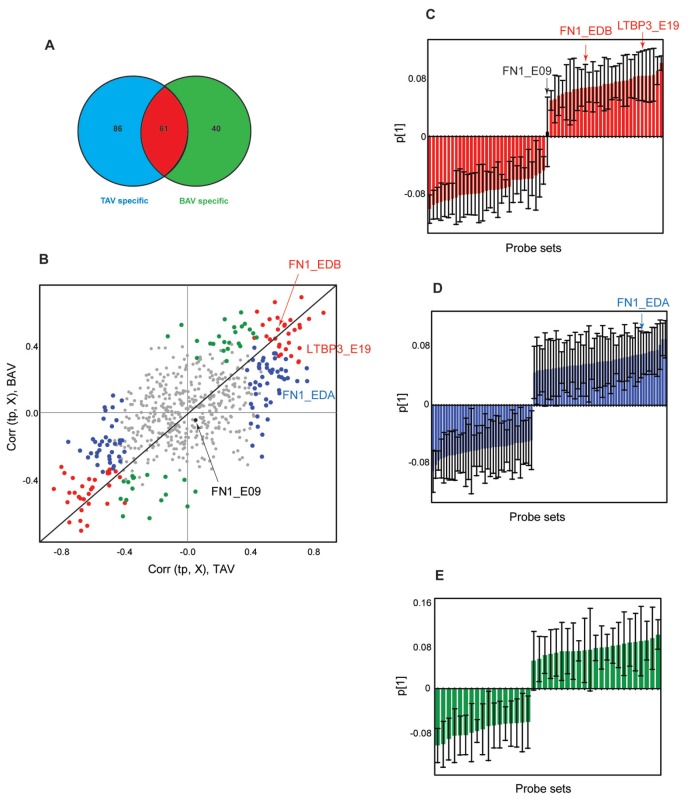
Venn diagram and OPLS-DA of gene level–normalized exon expression (splice-index) data included in the TGFβ pathway. (A) Venn diagram based on an FDR-corrected t test of dilated versus nondilated samples in TAV and BAV patients separately. TAV-specific (blue), BAV-specific (green), and common (red) exons are marked in the diagram. (B) Combined model scatter plot based on TAV dilated versus nondilated and BAV dilated versus nondilated OPLS-DA models. The exons found to be significant in (A) are color coded accordingly in the combined model scatter plot. The black diagonal is aimed for interpretation purposes. Bar plots showing the loadings of each of the significant exons and indicating their contribution to the first PC are shown in (C–E) and color coded according to (A). The confidence levels for each data point were estimated by a jack-knife algorithm. Exons chosen for RT-PCR validation are marked in (B–E).

