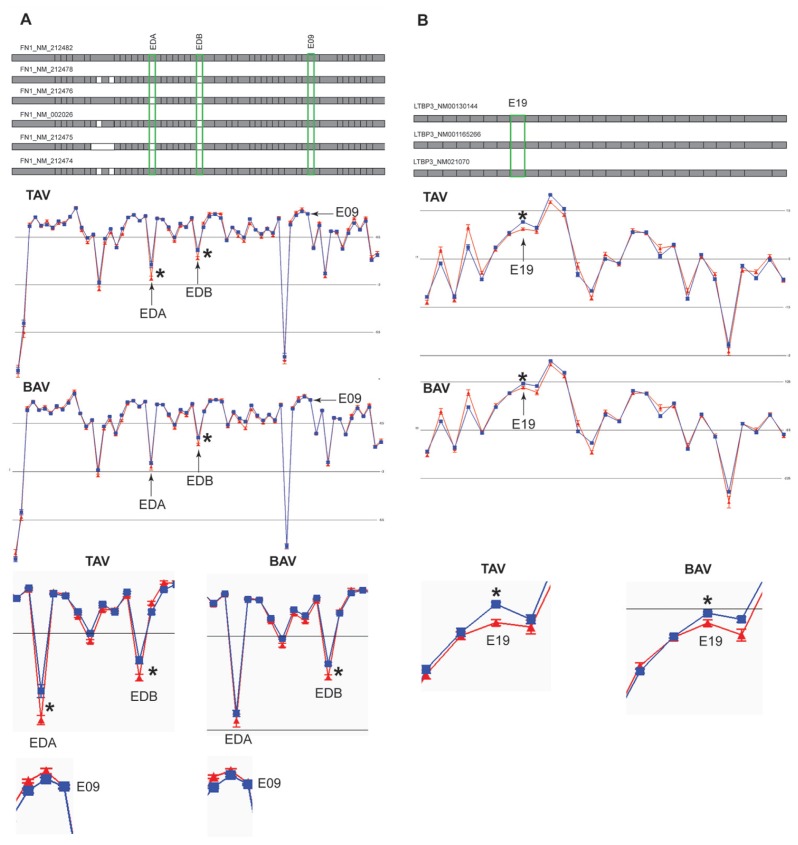
Figure 3.
The expression plot of alternative splicing events of genes chosen for RT-PCR validation. The expression is shown as mean log2 intensity of splice index data for each probe set (exon) for dilated (blue) and nondilated (red) samples in TAV and BAV patients separately. The isoforms known from the RefSeq database are shown on top with exons present in the particular isoform (gray box) and if absent (white box). The exons that were validated with RT-PCR are marked with green boxes in the RefSeq plot, by arrows in the expression plots and zoomed in to the particular exon of interest in the lower part of the figure. The RefSeq exons are position-matched with the expression plots probe sets (exons) below. FN1 is shown in (A) and LTBP3 in (B). The three isoforms in (B) do not show any difference at core level. The significance level (*) was calculated according to two methods, one null-hypothesis–driven t test for one variable at a time, by which the resulting P values have been corrected according to the FDR q-method, as well as a multivariate method by which jack-knife confidence levels and loading values have been calculated from OPLS-DA models (Figure 2, Table 1).

