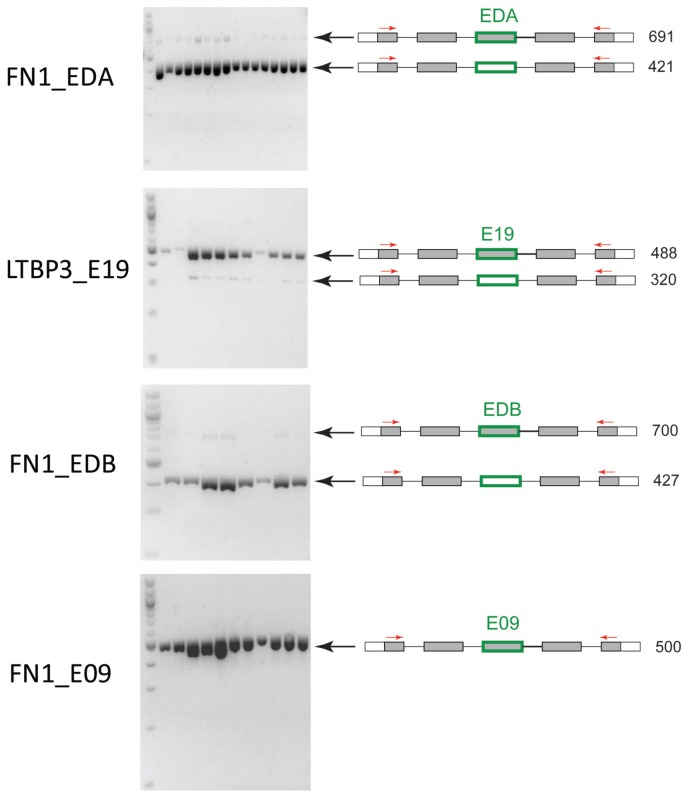
Figure 5.
RT-PCR validation of alternative splicing events. A set of exons found to be differentially expressed by statistical analyses (Figure 2) were chosen for RT-PCR validation of alternative splicing. (A) FN1_EDA, (B) LTBP3_E19 and (C) FN1_EDB show alternative splicing, and FN1_E09 (D) is not alternatively spliced and serves as a control. The gray boxes represent flanking exons in closest proximity to the exon that was investigated (marked in green around the box). Red arrows represent the position of the primers for RT-PCR. The length of the PCR product is shown in numbers. Black arrows indicate the position of the two isoforms on the gel.

