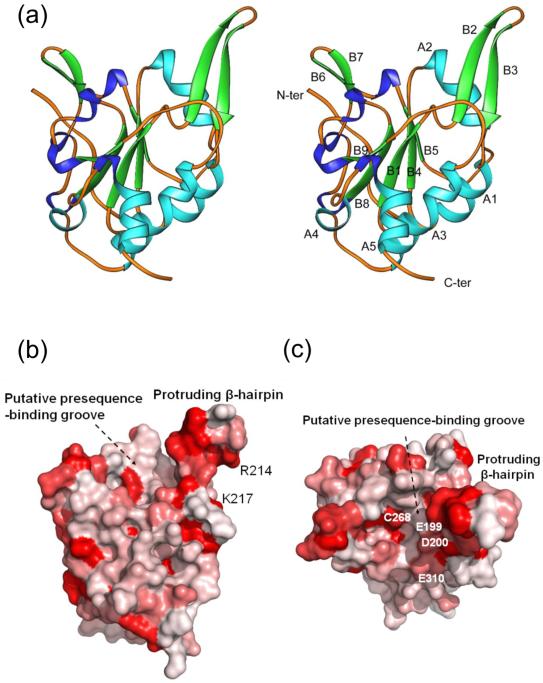
Fig. 1.
The Tim50 IMS-domain structure. (a) Ribbons drawing of the Tim50IMS monomer structure in side-by-side stereo mode. α-helices (A1 to A5) and β-strands (B1 to B9) are shown in light blue and green, respectively. Turns are shown in dark blue. (b) Sequence conservation drawing of the Tim50IMS molecular surface. The Tim50 sequences from ten species (S. cerevisiae, C. elegans, H. sapiens, D. melanogaster, N. crassa, D. rerio, M. musculus, B. taurus, P. pastoris and D. hansenii) were put into the ClustalW program for sequence alignment. The aligned sequences in multiple sequence alignment formats were converted into a property file by use of the program ProtSkin (http://www.mcgnmr.mcgill.ca/ProtSkin/). The property file was then visualized by using the program PyMol (http://www.pymol.org). Red color denotes conserved regions. The orientation is similar to that in A. (c) Tim50IMS of b is rotated along the horizontal axis by 90° and the protruding β-hairpin is facing the reader.

