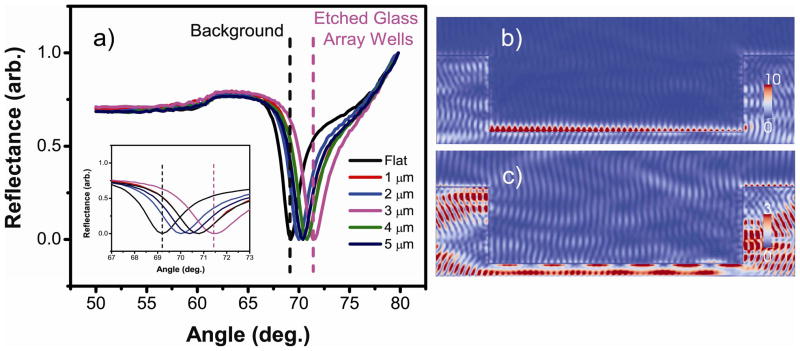
Figure 2.
Simulated reflectivity curves for the etched glass array coated with gold in water. a) Reflectivity curves for both the etched glass array and gold island array substrates. Inset: Magnified region around each reflectivity curve minimum. b) Electric field distribution in a 3 μm etched glass array spot at the resonance angle. c) Electric field distribution in a 3 μm etched glass array spot off the resonance angle. The scale for b) is more than three times larger than that of c).

