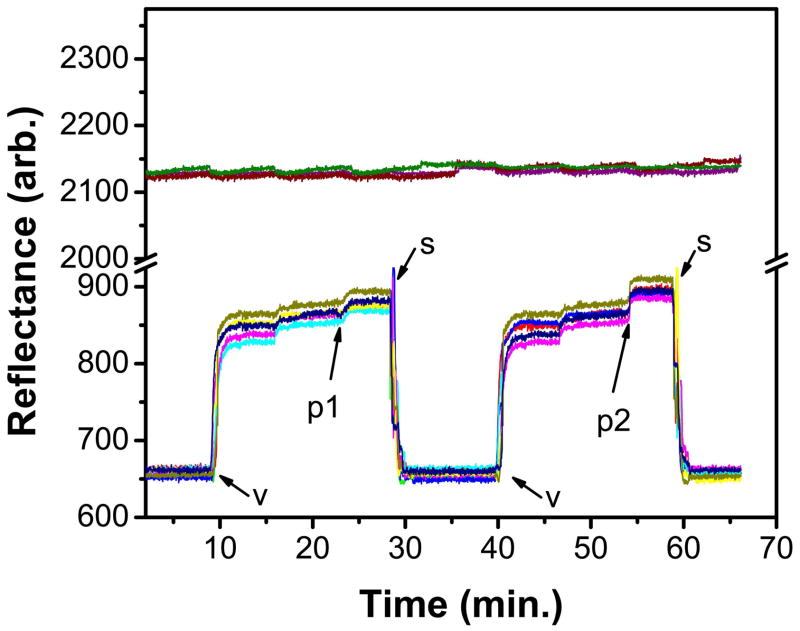
Figure 7.
SPR sensorgram from SPR imaging analysis on SiO2-coated gold etched array demonstrating biomolecular interactions. v: vesicles, 1 mg/mL PC/GM1 (95/5); p1: 10 μg/mL cholera toxin; p2: 20 μg/mL cholera toxin; s: surfactant, 5% Triton X-100. Two control responses (located ca. 2100 arb. on the y-axis) based off background signals on the same chip are shown as well. The small signal increase after each vesicle incubation is due to surface rinsing of non-specifically adsorbed vesicles.

