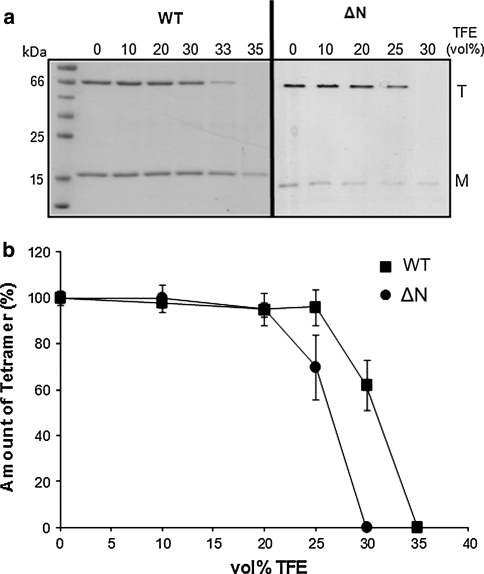
Fig. 2.
TFE-induced tetramer dissociation of WT and ΔN-KcsA in PE:PG (7:3 mol.%) lipid bilayers. a TFE-treated samples were analyzed by SDS-PAGE. Tetrameric (T) and monomeric (M) KcsA are indicated; and a protein marker (in kDa) is shown on the right. b Gels shown panel a were quantified for WT and ΔN-KcsA. The intensities of tetramer bands were assigned as a relative value of 100% observed for a TFE-untreated (0 vol% TFE) sample. Data points correspond to the average ± SD of three experiments

