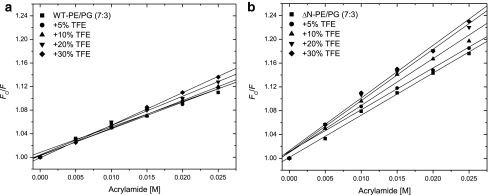
Fig. 4.
Representative Stern–Volmer plots of Trp fluorescence quenching by acrylamide in WT-KcsA (a) and ΔN-KcsA (b) in PE:PG (7:3 mol%) bilayers. Samples were investigated with or without certain concentrations of TFE (vol%) as indicated. The slopes of the best fit linear regression lines for each data set (K SV values) are shown in Table 1

