
Figure 4.
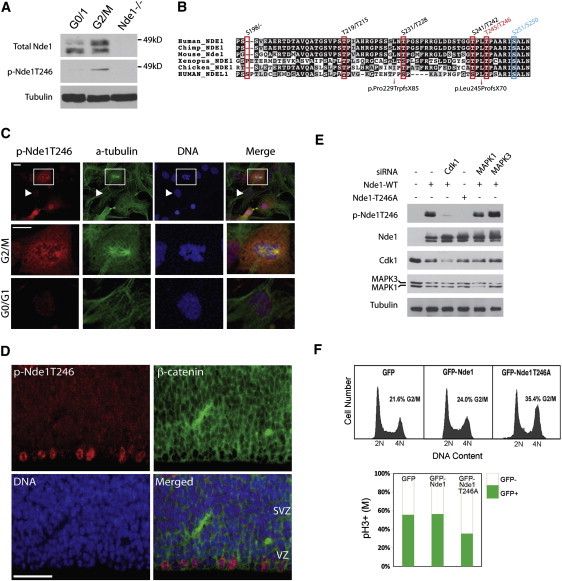
T246 of Nde1 is Phosphorylated by Cdk1 and Is Involved in the G2/M Transition
(A) Nde1 is phosphorylated during mitosis. Immunoblotting of Nde1 with total and phospho-specific Nde1 antibody from serum-starved G0 and mitotically arrested (G2/M) 293T cells and Nde1−/− cells (lanes 1, 2, and 3, respectively). A band of slowly migrating phosphorylated Nde1 (p-Nde1) is significantly elevated in the G2/M cell population (lane 2) and absent in the Nde1−/−-negative control (lane 3), indicating the phospho-Nde1 antibody specificity.
(B) Four out of five putative phosphorylation sites previously identified in Ndel1 are conserved in Nde1(T215, T228, T242, and T246). Among them, T246 and its flanking sequence are the most conserved and represent the only site disrupted in both mutant alleles. Both mutations also disrupt a potential AurA phosphorylation site (S250), on the basis of its sequence homology to Ndel1.
(C) Phospho-specific antibody against Nde1 T246 exclusively recognizes G2- and M-phase MEFs (upper panel). (Lower panels) Representative images of a mitotic cell (marked in square) and an interphase cell (marked by arrowhead). The scale bar indicates 10 μm.
(D) Immunohistological staining of the cerebral cortical ventricular zone from an E14.5 mouse brain with p-Nde1T246 antibody (red) and β-catenin (green) shows preferential staining of M-phase cell along the ventricular surface. The scale bar indicates 50 μm. The ventricular zone (VZ) and subventricular zone (SVZ) are indicated at their corresponding position in the image.
(E) Nde1 was phosphorylated at T246 by Cdk1 but not by MAPK1 or MAPK3. Two nanomoles of Silencer Select Pre-Designed and Validated siRNA to Cdk1, MAPK1, and MAPK3 siRNA (Ambion/Applied Biosystems) was cotransfected with 1 μg Nde1-WT/T246A plasmid into 293T cells. Immunosignals were abolished specifically by Cdk1 siRNA or by the Nde1-T246A point mutation but not by siRNA against MAPK1 or MAPK3.
(F) Cell-cycle profiles of 293T cells transfected with GFP, GFP-Nde1, and GFP-Nde1-T246A. An increased 4N (G2/M) population was observed by GFP-Nde1-T246A overexpression, suggesting the important role of p-Nde1T246 in cell-cycle progression. In addition, flow cytometry on the 4N population by phospho-histone H3 (pH3, mitotic marker) reveals that there are a decreased number of mitotic cells in the GFP-Nde1-T246A transfected cells despite the more abundant 4N population, suggesting that a large number of these cells arrested in the G2 phase. The y axis represents the ratio of pH3(+) to pH3(−) cells.