
Figure 3.
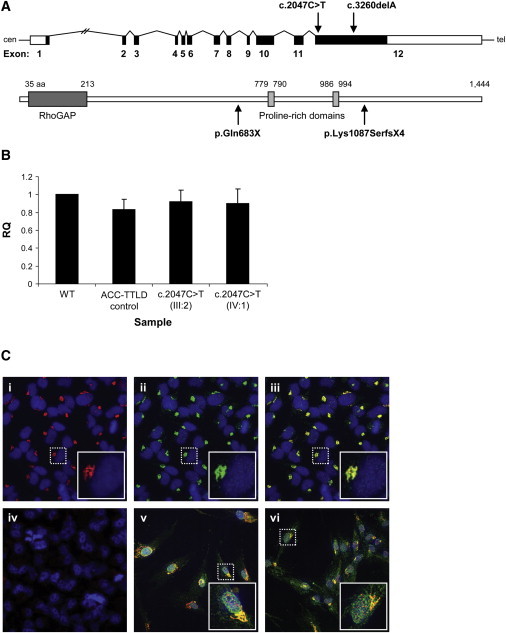
Transcript and Protein Expression in WT and Mutant Cells
(A) Schematic of the ARHGAP31 structure showing the position of the mutations identified in exon 12. The ARHGAP31 structure beneath depicts the known RhoGAP and proline-rich domains, a site of phosphorylation by GSK-3.
(B) Real-time quantitative RT-PCR is used for the examination of ARHGAP31 transcript levels in lymphoblasts from two related subjects heterozygous for the c.2047C>T nonsense mutation as compared to a genotypically normal control (WT). Patient and control samples show no appreciable difference in transcript expression. Sample identifiers refer to the pedigree structure in Figure 1B. The ACC-TTLD control is a patient with no ARHGAP31 mutation (molecular genetic basis unknown). Data represent mean ± standard deviation (SD) from three independent experiments. RQ is used as an abbreviation for relative quantification.
(C) Immunostaining of (i) endogenous ARHGAP31 (red) and (ii) Golgi (green); marked levels of colocalization to the Golgi apparatus in HeLa cells are visible (iii). The nucleus is stained in blue. (iv) The high specificity of the ARHGAP31 antibody is indicated by the absence of staining in the presence of blocking peptide to the binding epitope. In both (v) WT and (vi) mutant (p.Gln683X) fibroblasts, ARHGAP31 (green) localizes to the Golgi (red) and appears identical and of equivalent intensity. Images in the inset boxes show a 3× magnification of the single cells marked by the dashed lines.