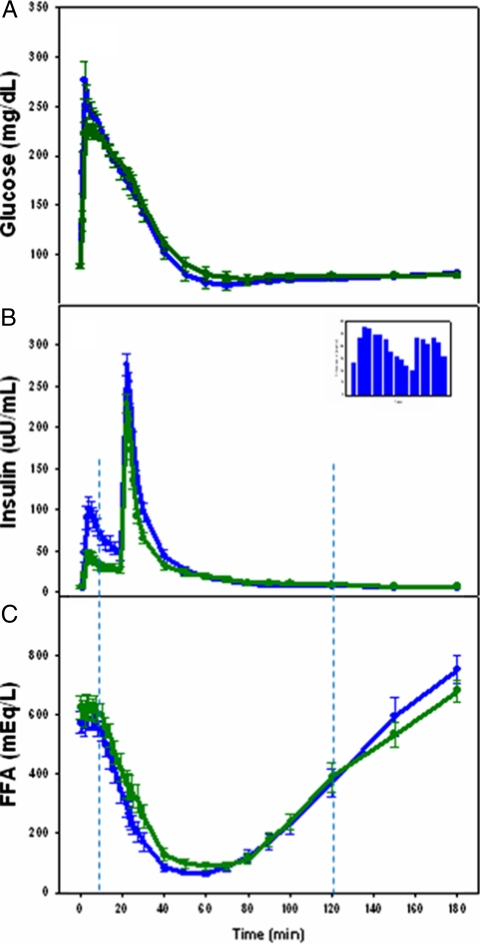
Fig. 2.
Glucose, insulin, and FFA time course during the IM-FSIGT. African-American women are presented by blue lines and white women by green lines. A, Glucose concentrations (mean ± se). B, Insulin concentrations (mean ± se). Inset shows race difference in insulin concentration between 2 and 30 min (all P < 0.05). C, FFA concentrations (mean ± se). Vertical dashed lines demarcate the time period from which data are obtained for entry into the FFA minimal model (i.e. 10–120 min).

