
Figure 3.
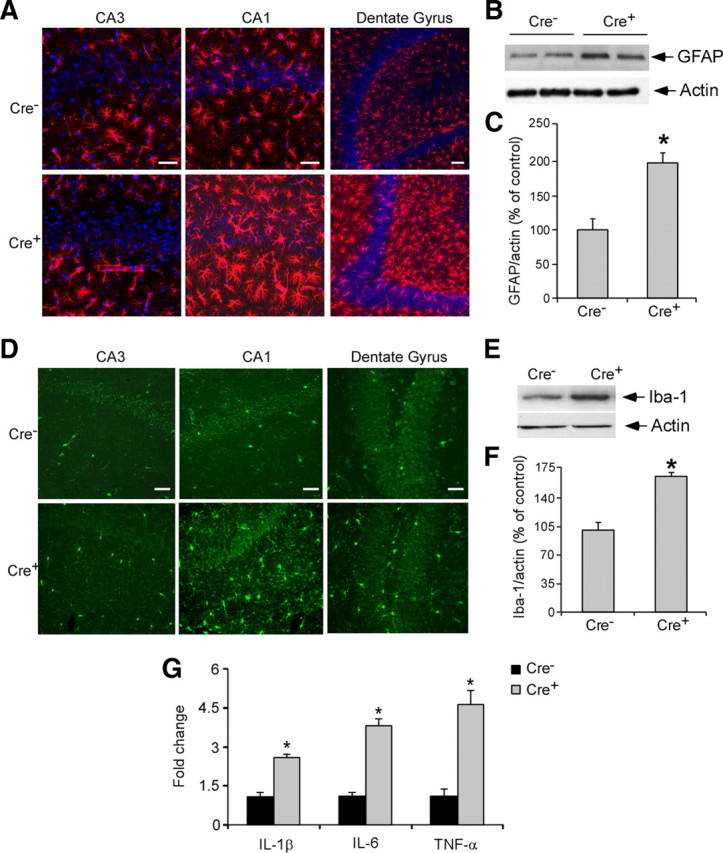
Neuroinflammation in LRP1 forebrain knock-out mice. A, Immunofluorescence staining using a GFAP antibody (detected with Alexa 568, red) and nucleic marker DAPI (blue). Shown are representative stainings of the hippocampus of 18-month-old Cre+ and Cre− mice. Scale bars, 50 μm. B, GFAP expression in the hippocampus was evaluated in 18-month-old Cre+ and Cre− mice by Western blotting. C, Densitometric quantification of GFAP expression was performed as described in Experimental Procedures (n = 4). Note that GFAP expression was significantly increased in Cre+ mice. D, Immunofluorescence staining using a Iba-1 antibody (detected with Alexa 488, green). Shown are representative stainings of the hippocampus of 18-month-old Cre+ and Cre− mice. Scale bars, 25 μm. E, Iba-1 expression in the hippocampus was evaluated in 18-month-old Cre+ and Cre− mice by Western blotting. F, Densitometric quantification of Iba-1 expression was performed as described in Experimental Procedures (n = 4). Note that Ib-1 expression was significantly increased in Cre+ mice. G, Expression of IL-1β, IL-6, and TNF-α at the mRNA level in the hippocampus of 18-month-old Cre+ and Cre− mice (n = 5) was evaluated by real-time PCR. Note that the levels of IL-1β, IL-6, and TNF-α were significantly increased in the Cre+ mice compared with Cre− mice. The data represent the means ± SD of at least four separate animals. *p < 0.01.