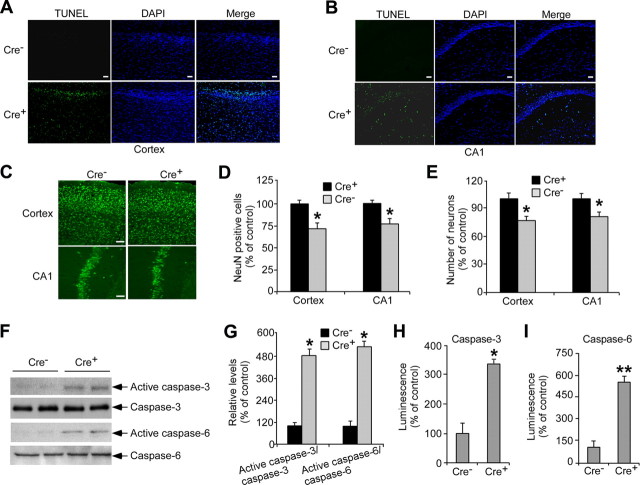
Figure 5.
LRP1 deletion leads to age-dependent neurodegeneration. A, B, TUNEL staining was performed in the cortex and hippocampal CA1 regions of 24-month-old Cre+ and Cre− mice (n = 5). Representative images of TUNEL staining are shown (detected with FITC, green and nucleic marker DAPI, blue). Scale bars, 25 μm. C, D, NeuN staining was performed in the cortex and hippocampal CA1 region of 24-month-old Cre+ and Cre− mice (n = 5). Representative images of NeuN staining are shown (detected with Alexa 488, green). Scale bars, 25 μm. E, Stereological analysis was performed in the cortex and hippocampal CA1 region of 24-month-old Cre+ and Cre− mice (n = 5). F, Levels of active-caspase-3, active-caspase-6, total caspase-3, and total caspase-6 in the cortex were evaluated in 24-month-old Cre+ and Cre− mice by Western blotting. G, Densitometric quantification of active caspase versus total caspase was performed as described in Experimental Procedures (n = 4). Note that active-caspase-3 and active-caspase-6 levels were significantly increased in Cre+ mice. H, I, Caspase-3 and caspase-6 activities were measured using a luciferase-based assay system (Promega), normalized against total protein, and plotted as a percentage of Cre− controls (n = 4). Scale bars, 100 μm. The data represent the means ± SD of at least four separate animals. *p < 0.05, **p < 0.01.

