Figure 2.
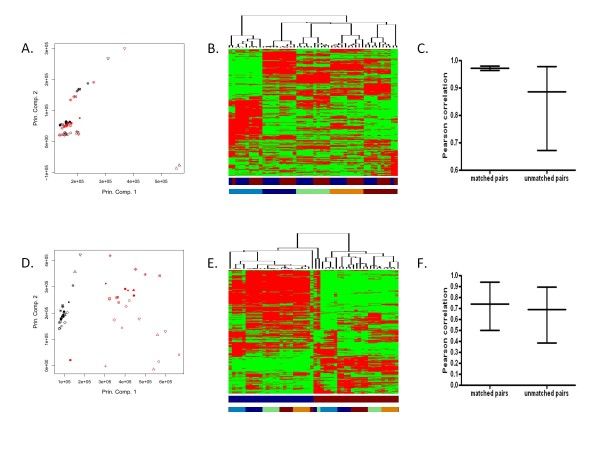
Patterns of whole-genome expression among paired samples. (A) Principal component analysis of the MAS5.0 normalized gene expression data from the fresh-frozen xenografts processed with the Affymetrix One-Cycle versus MessageAmp Premier protocol. Shapes represent samples; Affymetrix One-Cycle in black and MessageAmp Premier in red. (B) Unsupervised hierarchical clustering of the MAS5.0 normalized gene expression data from fresh-frozen xenografts processed with the Affymetrix One-Cycle versus MessageAmp Premier protocol. Columns represent samples; rows represent genes; higher expression in red and lower in green. Color bar below data matrix defines Affymetrix One-Cycle in blue and MessageAmp Premier in red. Second color bar defines samples associated with DM6 in dark blue, DM366 in light blue, DM440 in green, DM443 in orange, and DM738 in red. (C) Pearson correlation coefficients for whole-genome expression data from matched and unmatched pairs of fresh-frozen xenografts processed according to the Affymetrix One-Cycle versus MessageAmp Premier protocol. (D) Principal component analysis of the MAS5.0 normalized gene expression data from fresh-frozen xenografts versus FFPE xenografts processed with the MessageAmp Premier protocol. Shapes represent samples; fresh-frozen in black and FFPE in red. (E) Unsupervised hierarchical clustering of the MAS5.0 normalized gene expression data from fresh-frozen xenografts versus FFPE xenografts processed with the MessageAmp Premier protocol. Representations are as in (B), except the color bar below the data matrix defines fresh-frozen samples in blue and FFPE samples in red. (F) Pearson correlation coefficients for whole-genome expression data from matched and unmatched pairs of fresh-frozen xenografts versus FFPE xenografts processed with the MessageAmp Premier protocol.

