Figure 3.
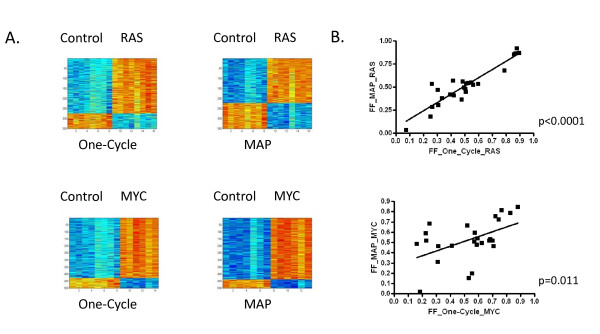
Status of RAS and MYC pathway activities in fresh-frozen xenografts processed according to the Affymetrix One-Cycle protocol compared to the MessageAmp Premier protocol. (A) Heatmaps representing the expression levels of genes comprising the gene expression signature that differentiates between HMECs infected with adenovirus expressing GFP (control) versus HMECs infected with adenovirus expressing RAS or MYC as indicated. Within the heatmap, columns represent samples and rows represent genes, with expression values on a low to high continuum represented by a blue to red continuum, respectively. (B) Scatterplot of the Affymetrix One-Cycle protocol (X-axis) versus the MessageAmp Premier protocol (Y-axis) for the RAS pathway (top) or MYC pathway (bottom). The simple linear regression model and p-value is drawn for each Pearson correlation.

