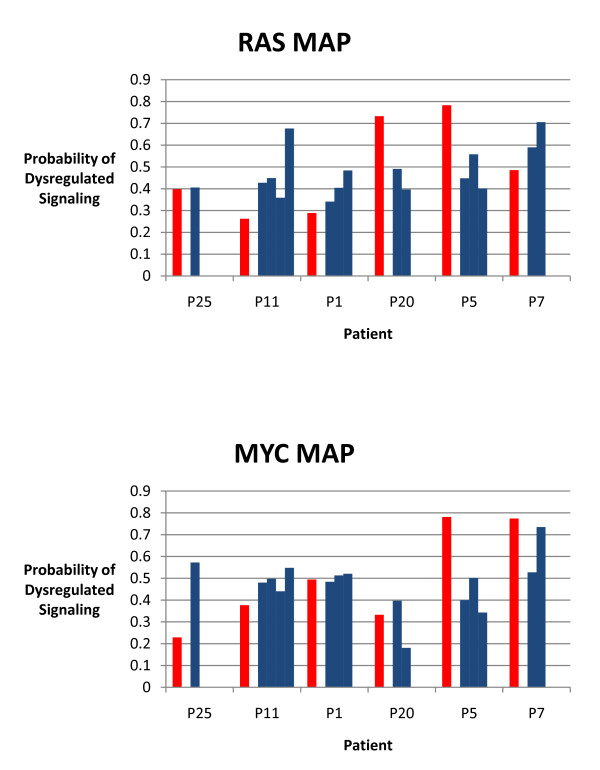
Figure 5.
Status of RAS and MYC pathway activities in patient matched fresh-frozen and FFPE melanomas. Graphs represent the pathway predictions for the status of the RAS pathway (top) and MYC pathway (bottom) in fresh-frozen and FFPE samples for patients as indicated. Blue bars represent fresh-frozen samples and red bars represent FFPE samples.

