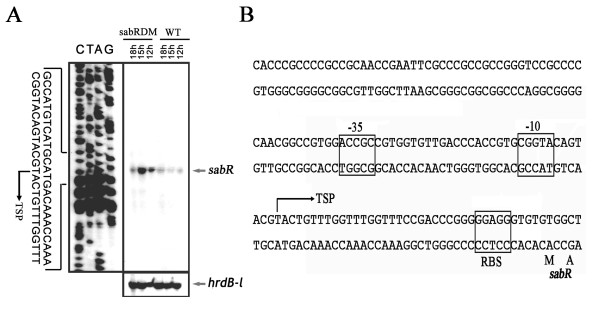
Figure 1.
Transcriptional analysis of sabR. A, High resolution S1 nuclease mapping of sabR. The sabR transcripts were detected at 12, 15 and 18 h of growth from the wild-type strain (WT) and sabR disruption mutant (sabRDM). The arrowhead indicates the transcription start point (TSP) of sabR. The S. ansochromogenes hrdB-l encoding a principal sigma factor was used as control. B, The nucleotide sequence of promoter region of sabR.

