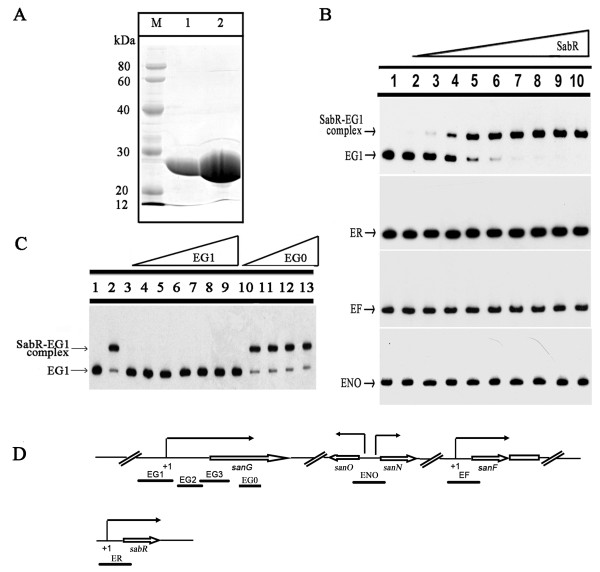
Figure 4.
EMSA analysis of SabR binding to the upstream of sanG, sabR, sanN, sanO and sanF. A, Purification of the SabR-His6 from E. coli. M, protein marker; 1 and 2, purified SabR-His6 protein. B, The upstream region of sanG, sabR, sanN, sanO or sanF was incubated with or without increasing amounts of SabR-His6 (lanes 1-10 contain 0, 52, 104, 130, 208, 260, 390, 520, 650 and 780 nM, respectively). C, Competition assays using unlabeled specific DNA EG1 and nonspecific competitor DNA EG0. Lanes 3-9, EMSA of 208 nM SabR-His6 with labeled probe and unlabeled specific competitor EG1. Lanes 10-13, EMSA of 208 nM SabR-His6 with labeled probe and nonspecific competitor EG0. The arrows indicate the free probe and SabR -DNA complexes. D, The gene organization of sanG, sanNO, sanF and sabR.

