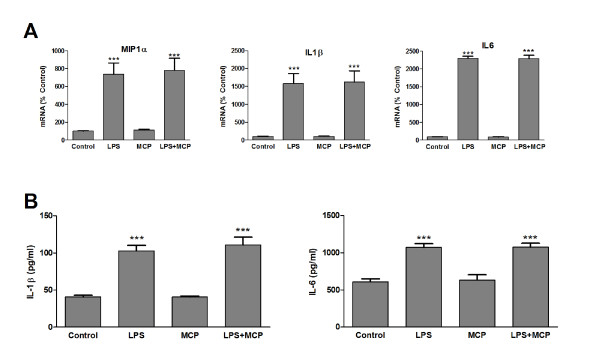
Figure 4.
Expression of pro-inflammatory cytokines. (A) Microglia were incubated for 24 h with fresh media (control), LPS 1 μg/ml, MCP-1 50 ng/ml or a combination of LPS and MCP-1 at the indicated concentrations. RNA was isolated and MIP-1α, IL-1β and IL6 mRNA levels determined by RT-PCR. Data are expressed as percentage of control values (set to 100%); ***p < 0.0001 versus control. Data are expressed as mean ± SE for n = 6 replicates per group. (B) Microglia were incubated for 24 h with fresh media (control), LPS 1 μg/ml, MCP-1 50 ng/ml or a combination of LPS and MCP-1 at the indicated concentrations. IL-1β and IL-6 levels in the media were assessed by ELISA. ***p < 0.0001 versus control. Data are expressed as mean ± SE for n = 10 replicates per group.

