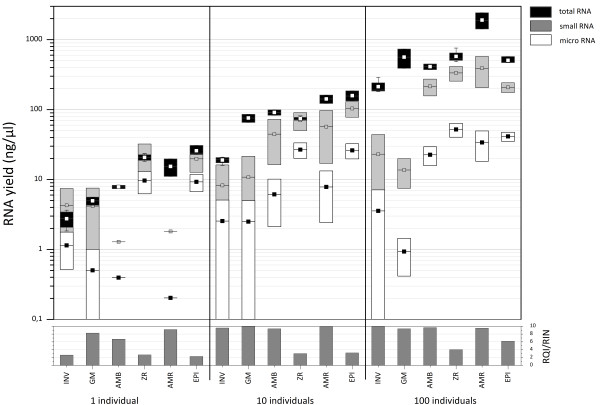
Figure 2.
Boxplot summary of all data. Semilogarithmic boxplot breakdown of RNA yield for totalRNA, smallRNA and microRNA of all assessed totalRNA extraction kits for 1, 10 and 100 Gyrodactylus salaris specimens. RQI/RIN values of the totalRNA as determined by the instrument software following the Experion and 2100 Bioanalyzer electrophoresis systems are depicted at the bottom. Boxes indicate the 25-75% intervals, squares the mean, and whiskers the standard deviation, where this lies outside the 25-75% interval.

