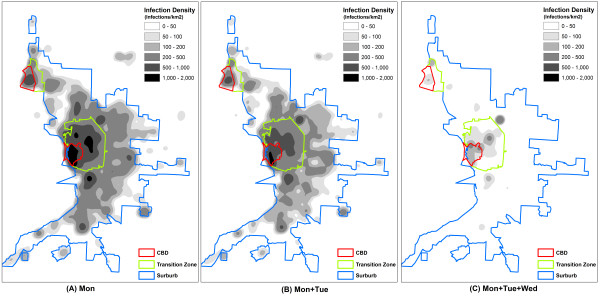
Figure 4.
Continuous weekend-extension strategies (2). Spatial patterns of infections resulted from the three continuous weekend-extension strategies, given R0 = 1.4 and compliance level = 100%: (a) Mon, (b) Mon+Tue, and (c) Mon+Tue+Wed. Each 50 m × 50 m cell value indicates the total number of infections during the 200 days at the cell location (infections/per km2). All cell values are averages of 50 randomly seeded simulation runs.

