
Figure 1.
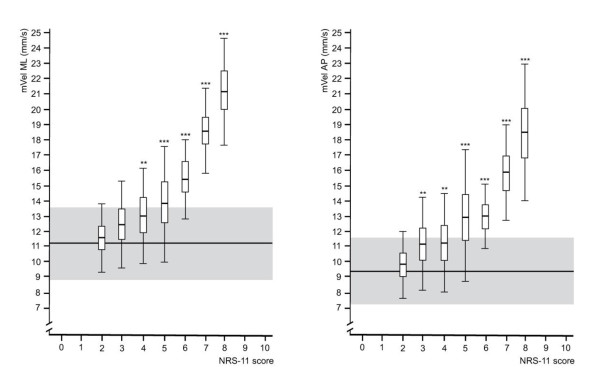
Relationship between pain intensity and mean sway velocity in AP and ML. The horizontal line and the grey area indicate the mean score of healthy controls and the standard deviations respectively. The vertical lines indicate standard deviations; the boxes show mean and 95% CIs respectively. Levels of significance compared to controls: * p ≤ 0.05, ** p ≤ 0.01, *** p ≤ 0.001.