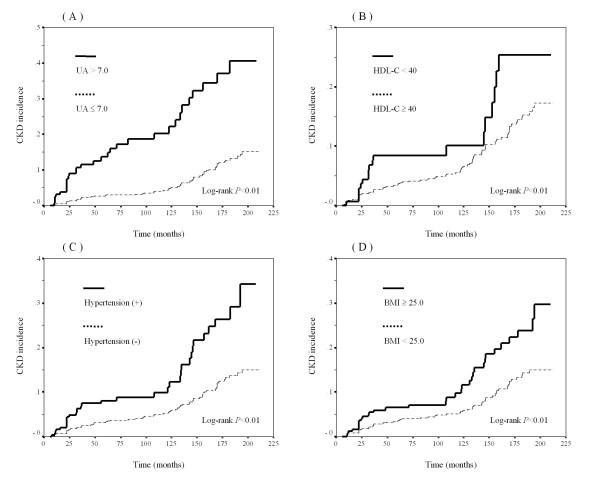
Figure 1.
Kaplan-Meier curves and Log-rank tests of CKD incidence. The Kaplan-Meier curves show the follow-up periods (in months) and cumulative incidence rate of CKD. Solid lines represent cumulative incidence rates of CKD in participants with hyperuricemia (A), low serum HDL-C (B), hypertension (C) and obesity (D) while dotted lines represent for the CKD rate in participants without these factors. Log-rank tests were performed to determine differences in cumulative incidence rates. P values are shown in the figures. (A) UA > 7.0 mg/dL versus UA ≤ 7.0 mg/dL. (B) HDL-C < 40 mg/dL versus HDL-C ≥ 40 mg/dL. (C) (SBP ≥ 140 mmHg or DBP ≥ 90 mmHg) versus (SBP < 140 mmHg and DBP < 90 mmHg). (D) BMI ≥ 25.0 kg/m2 versus BMI < 25.0 kg/m2. CKD, chronic kidney disease; UA, uric acid; HDL-C, high-density lipoprotein cholesterol; SBP, systolic blood pressure; DBP, diastolic blood pressure; BMI, body mass index.

