Figure 2.
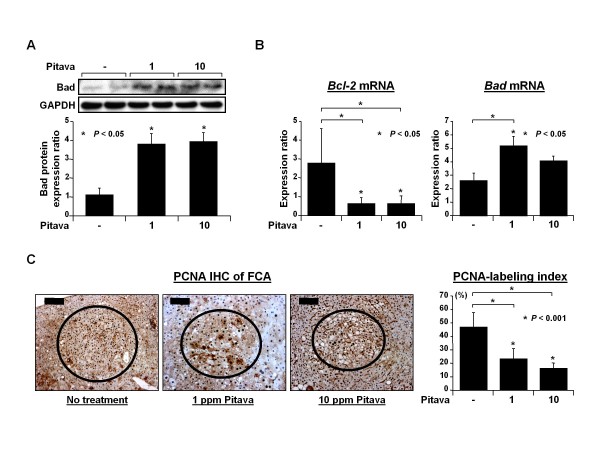
Effects of pitavastatin on the expression levels of Bad and Bcl-2 in the liver and cell proliferation in FCA induced by DEN in db/db mice. (A) The total proteins were extracted from the livers of experimental mice and the expression levels of the Bad protein were examined by western blot analysis (upper panel). The intensities of the blots were quantified by densitometry (lower panel). GAPDH antibody served as a loading control. Two lanes represent protein samples obtained from 2 different mice in each group. Repeat western blots yielded similar results. Values are the means ± SD. * P < 0.05 vs. the untreated group. (B) The total RNAs were isolated from the livers of experimental mice and the expression levels of Bcl-2 and Bad mRNAs were examined by quantitative real-time RT-PCR using specific primers. The expression levels of each mRNA were normalized to the level of GAPDH mRNA. Values represent the means ± SD. * P < 0.05 vs. the untreated group. (C) Representative pictures of the PCNA-immunohistochemical analysis of FCA (circled) developed in the livers of Groups 1, 2, and 3 (left panels). The PCNA-labeling indices of FCA developed in the livers of Groups 1 through 3 were determined by counting the PCNA-positive nuclei in FCA (right panel). Scale bars, 200 μm (no treatment) and 100 μm (1 and 10 ppm pitavastatin). * P < 0.001 vs. the untreated group.

