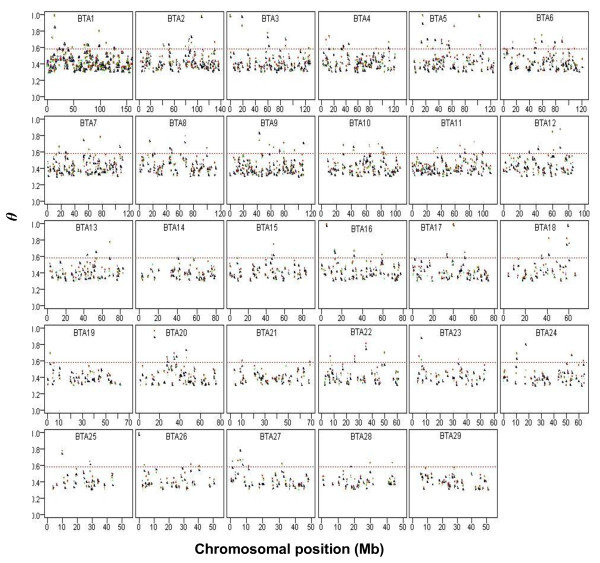
Figure 6.
Genome-wide distribution of FST signals. Windows with FST > 0.3 in all pair-wise comparisons, indicating the genomic position of the most diverse regions between dairy and beef breeds. Blue, black, red, and green dots represent FST values for HS-CN, HS-PI, BS-CN, and BS-PI, respectively, in each window. Dashed lines display the threshold level of 2.5%.“

