
Figure 6.
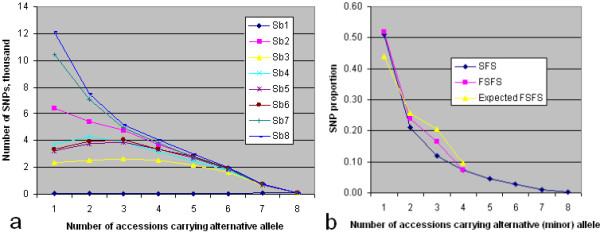
Allele-frequency distributions of SNPs from the RAD_P sequencing library. a) Each point for an accession denotes the number of SNPs having the indicated alternative (non-BTx623)-allele frequency in which that accession carried or was imputed the alternative allele. It is computed from original plus imputed SNP genotype data; the plot from only original complete data is essentially identical. b) Unfolded- (SFS) and folded- (FSFS) site-frequency-spectrum plots showing distribution of alternative (SFS) or minor (i.e. whether BTx623 or non-BTx623) (FSFS) allele by numbers of accessions. Expected FSFS: the FSFS expected under the infinite-sites, no-selection model with random mating; see text.