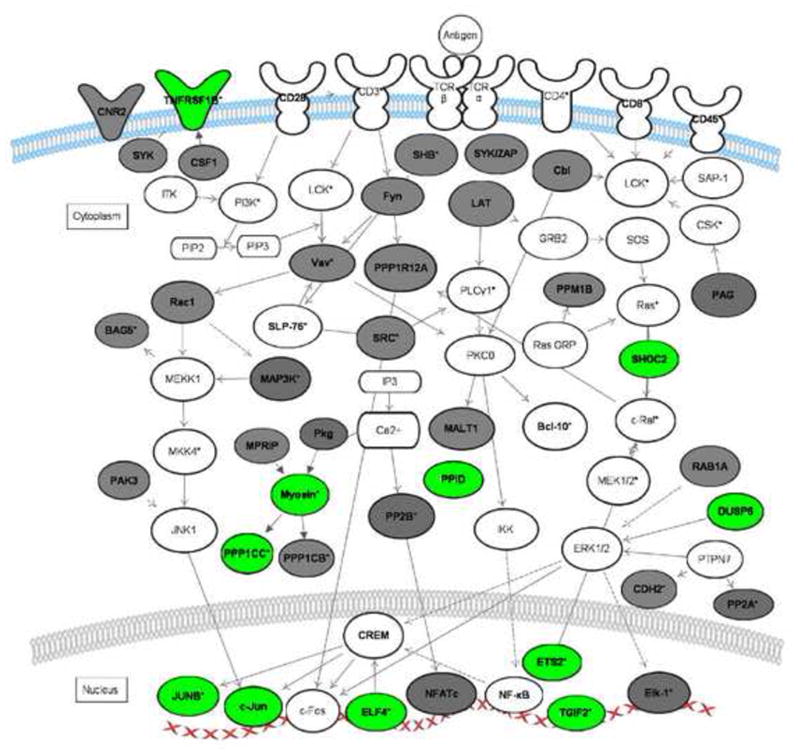
Figure 1. T-cell receptor signaling pathways regulated by GREs.

The network diagram depicts the coordinate regulation of GRE-containing transcripts involved in T cell receptor signaling. Transcripts in bold are GRE-containing. Transcripts in grey were identified as CELF1 targets in HeLa cells by RNA-IP [43].
Transcripts in green represent short-lived GRE-containing transcripts expressed in primary human T cells [33], [37]. Transcripts labeled with an asterisk exhibited changes in steady state levels following T-cell receptor stimulation [33]. This network diagram was built using Ingenuity Pathway Assistant Software.
