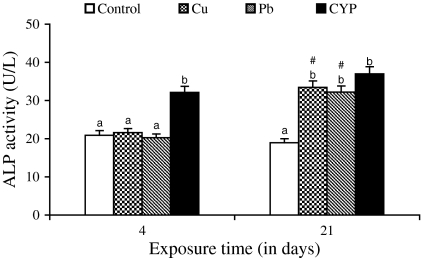
Fig. 3.
Serum ALP activity in O. niloticus exposed to toxicants for 4 and 21 days. Data are expressed as mean ± standard error (N = 6). Different letters indicate significant differences among groups at the same time (P < 0.05). # shows significant differences between time for the same exposure group (P < 0.05)

