
Figure 3.
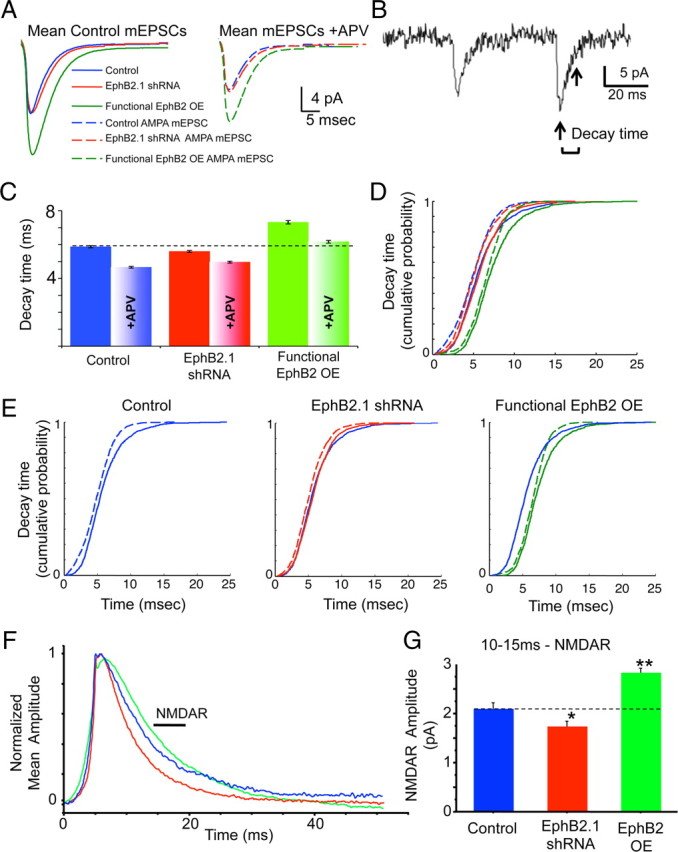
EphB2 regulates synaptic localization of functional NMDARs in mature cortical neurons. Whole-cell patch-clamp recordings were made from 21–23 DIV cultured rat cortical neurons expressing eGFP and shRNA vector (control; blue), EphB2 shRNA (EphB2.1 shRNA; red), or EphB2 shRNA plus “rescue” EphB2 (functional EphB2 OE; green) (A–E). A, Mean traces of EPSCs for each condition. B, Sample trace of whole-cell patch-clamp recording illustrating decay time. Decay time was calculated as the time from peak amplitude of the current to 30% of the peak amplitude, indicated by the arrows. C, Quantification of average decay time for each condition. D, E, Cumulative probability histograms of mEPSC decay times for each condition, plotted together (D) and individually for clarity (E). Control/EphB2.1 shRNA, p < 0.05; EphB2.1 shRNA/functional EphB2 OE, p < 0.0001; without APV/with APV, p < 0.0001 for all conditions; control with APV/functional EphB2 OE with APV, p < 0.0001; EphB2.1 shRNA with APV/functional EphB2 OE with APV, p < 0.0001; K-S tests; N as in Figure 1. These findings indicate that the slow NMDAR component of mEPSCs is reduced by EphB2 knockdown (EphB2.1 shRNA) and increased when EphB2 is functionally overexpressed (EphB2.1 shRNA plus “rescue” EphB2). F, Whole-cell patch-clamp recordings were made from 21–23 DIV cultured rat cortical neurons expressing eGFP and vector (control; blue), EphB2.1 shRNA (red), or EphB2 (EphB2 OE; green). Normalized amplitude plot of the mean mEPSCs recorded at +50 mV in control, EphB2 shRNA, and EphB2 OE neurons. G, Quantification of NMDAR component of the mEPSCs recorded at +50 mV in the presence of Mg2+ (control, n = 368 events/6 cells; EphB2 shRNAi, n = 744/11; EphB2 OE, n = 1247/9). *p < 0.05, **p < 0.001, ANOVA. Error bars indicate SEM.