
Fig. 4.
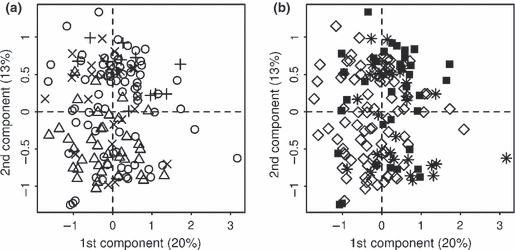
Principal component analysis (PCA) of 150 non-Shigella Escherichia coli strains based on their growth yield on 95 carbon sources. In (A) the symbols correspond to the phylogroups: A/B1 (o), B2 (Δ), D (×) and E (+) (the three ungrouped strains were discarded). In (B) the symbols correspond to the pathogenic groups: commensal (⋄), ExPEC (*), InPEC (▪). Percentages of total variance explained by the axes are given in parentheses.