
Fig. 6.
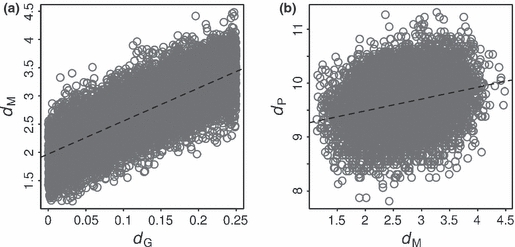
Relationships between metabolic pathway completion distance, dM, and genetic distance, dG, (a) and between metabolic phenotypic distance, dP, and dM (b) resulting from the simulation of 10 000 strain pairs with a metabolic network composed of 395 pathways. The dashed lines correspond to the regression of dM according to dG (a) and dP according to dM (b).