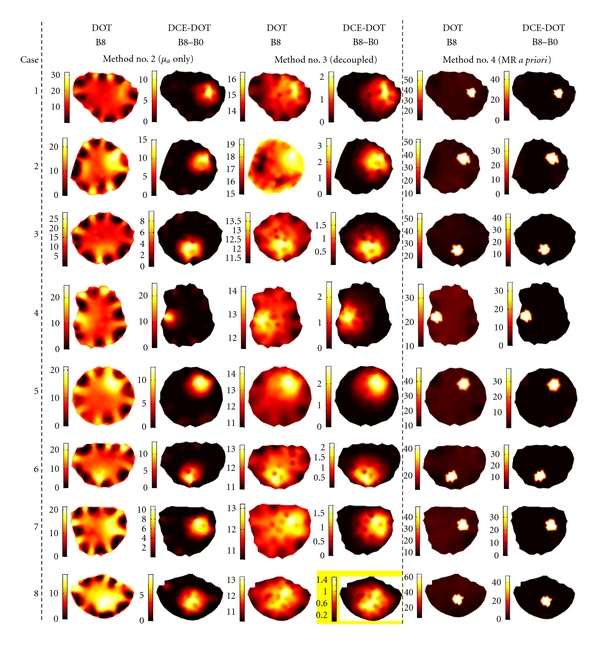
Figure 4.

Comparison among different methods of reconstruction for the absorption coefficient, μ a (m−1), please note that unit of m−1 is used for display purposes. The first and second columns present the reconstructed regular DOT and DCE-DOT absorption maps for B8 using analysis Method no. 2 (reconstructing μ a only). The third and fourth columns show the reconstructed maps using analysis Method no. 3 (taking the source-detector coupling factor into account), while the fifth and sixth columns are for the reconstructed maps using analysis Method no. 4 (MR a priori information is used). When the source-detector coupling factor is considered, the hypersensitivity at the source-detector positions due to coupling errors is reduced. Furthermore, when MRI a priori information is utilized, the inclusion can be clearly identified without background artifacts.
