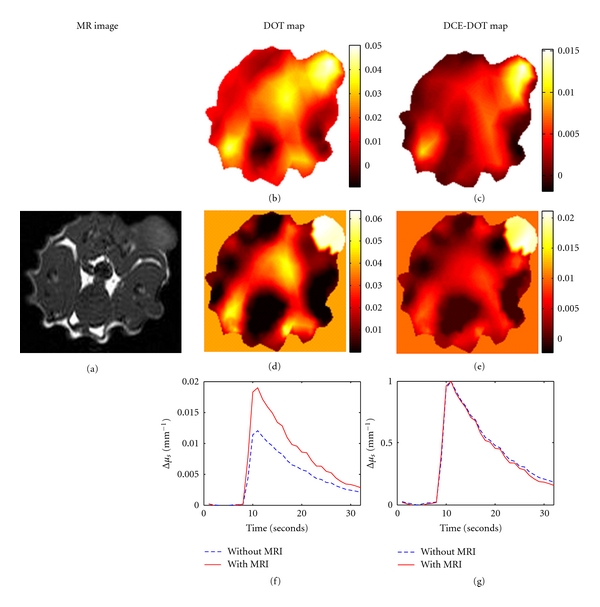
Figure 7.

Results from an in vivo study using Fischer rats for both regular and dynamic contrast enhancement DOT. (a) shows the T1 image of the rat at the slice that DOT data were acquired. (b) and (d) show the peak reconstructed DOT maps without and with MRI a priori information, respectively. (c) and (e) show the DCE-DOT differential maps without and with a priori information (i.e., the baseline map is subtracted from the peak absorption map). Finally, (f) shows the dynamic enhancement curves using the recovered absorption coefficient in the ROI. (g) displays the normalized DCE curves with respect to the maximum value.
