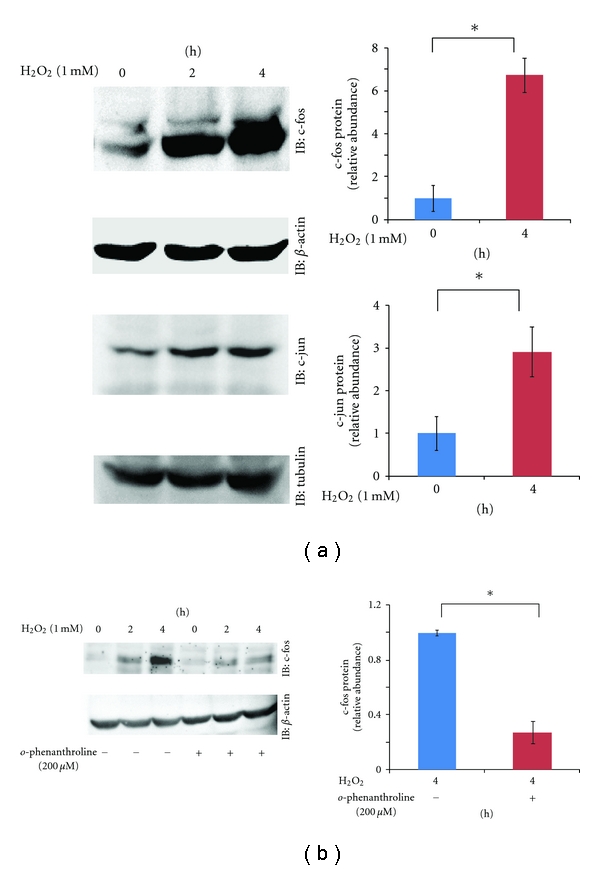
Figure 1.

(a) Upregulation of AP-1 gene expression in SiHa cells at the indicated time points after H2O2 (1 mM) exposure. Representative blots are shown and include β-actin or tubulin as a loading control, along with the results of densitometric analysis (0 h, 4 h; normalized to β-actin or tubulin). *P < 0.05, n = 3. (b) Inhibitory effect of o-phenanthroline on H2O2-induced c-fos upregulation. Cells were pretreated for 1 hour with or without o-phenanthroline (200 μM) before H2O2 (1 mM) exposure. Representative blots are shown and include β-actin as a loading control, along with the results of densitometric analysis (4 h; normalized to β-actin). *P < 0.05, n = 4.
