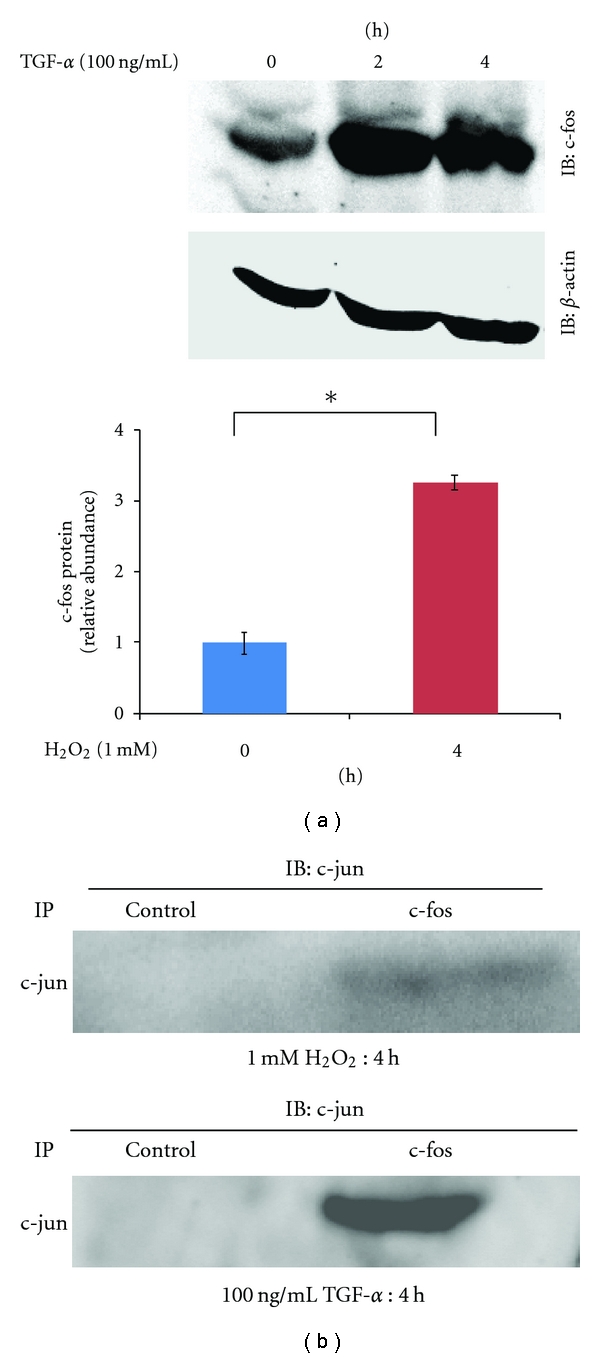
Figure 2.

(a) c-fos upregulation in SiHa cells after TGF-α (100 ng/mL) treatment. Cells were harvested at the indicated time points and used for Western blotting analysis. Representative blots are shown and include β-actin as a loading control, along with the results of densitometric analysis (0 h, 4 h; normalized to β-actin). *P < 0.01, n = 3. (b) IP of c-fos was performed using whole-cell extracts. Coprecipitated proteins were detected by Western blotting analysis using antibodies specific to c-jun.
