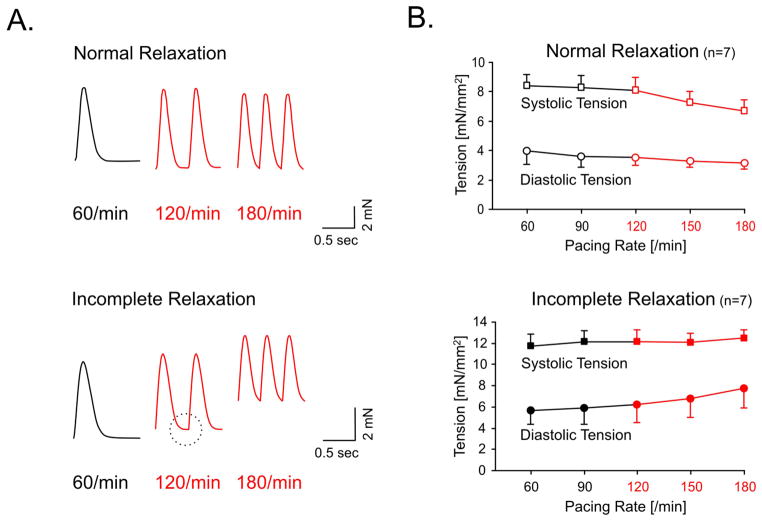
Figure 1.
Panel A depicts two force tracings of paced human myocardial strips. The upper tracing shows a normal relaxation up to the highest rate. The lower tracing demonstrates incomplete relaxation that is first apparent at 120/min (circle). At 180/min diastolic tension is markedly increased resulting in a diastolic contracture. Panel B shows average peak systolic force (■) and average diastolic tension (●) after grouping the experiments according to their relaxation behavior (normal vs. incomplete). The group of preparations that displayed incomplete relaxation showed a rise in diastolic tension as the rate was increased (p<0.05). Rates typical for tachycardia are in red.

