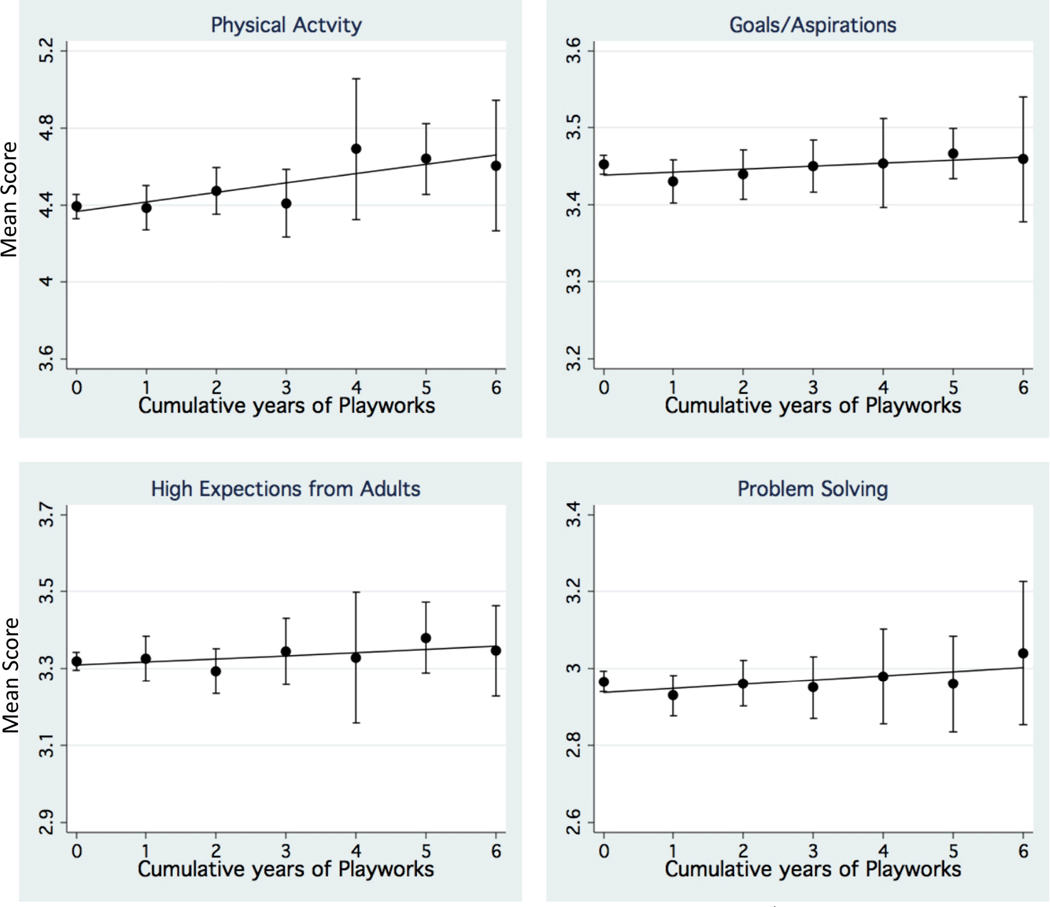
FIGURE 2. Trends in physical activity and protective factors with each additional year of exposure to Playworks.
Unadjusted mean school scores with 95% CI by number of years a 5th grade student would have been exposed to Playworks, with best fit trend lines. Range for vertical axis reflects mean initial score ± 2 SDs for each of the four variables shown.

