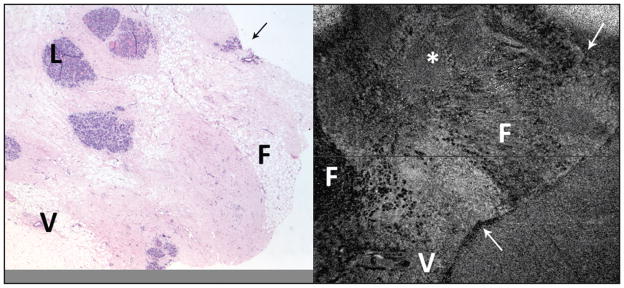
Figure 6.
Benign breast tissue (left, hematoxylin–eosin at 2× objective magnification; right, spectral domain optical coherence tomography (SD-OCT) 6 × 6 mm area). Using distinctive tissue shape features (arrows), it was possible in this instance to locate the hematoxylin–eosin area that corresponds to the SD-OCT scanned area. Despite this, there is some variation in the histology features (slide was cut before study, resulting in slightly different appearance of the “shallower” tissue that went onto the slide). Fat (F) is visible in both images, as are vessels (V). An asterisk (*) marks an area in the SD-OCT scan that probably correlates with benign breast lobules (L) seen in the hematoxylin–eosin image.

